Your Home Is Not the Average Home
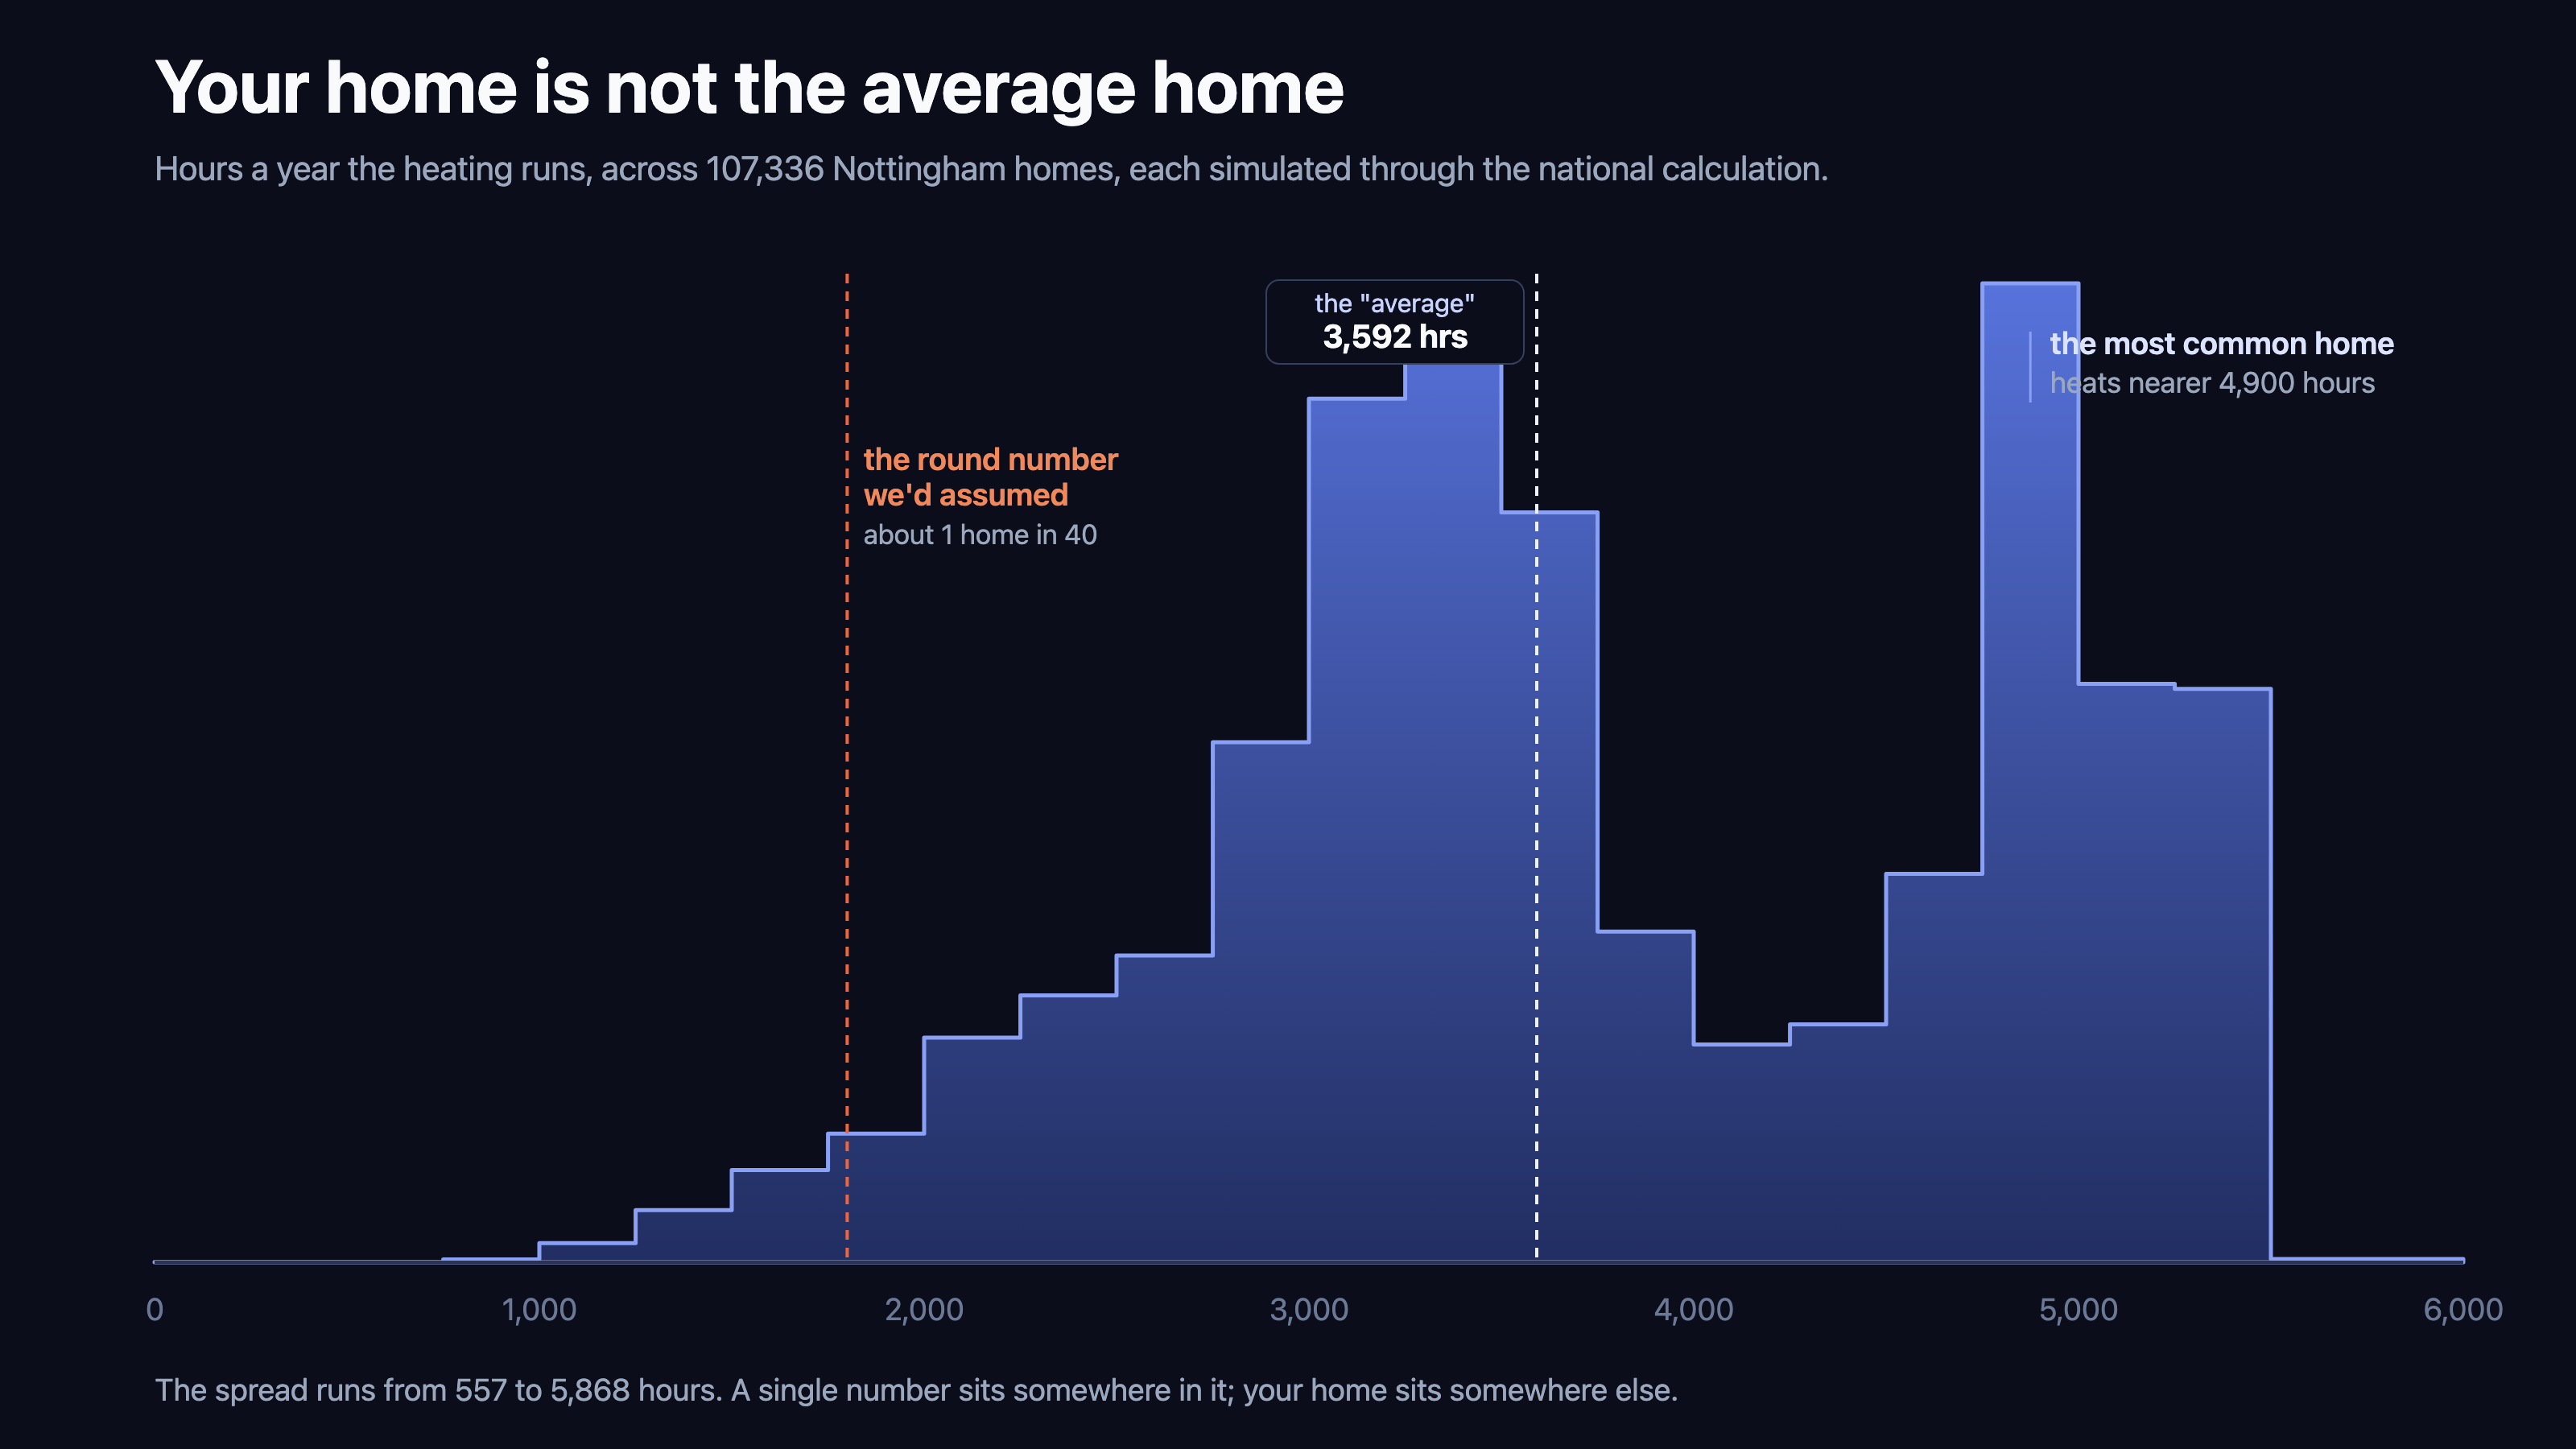
This curve is live. Open the distribution view to move the marker and read where any home on it sits.
Almost everything you are told about your home's energy comes as a single number. The certificate gives it a band. The heat pump quote gives it a running cost. The retrofit estimate gives it a saving. Each of those turns your home's details, plus a set of standard assumptions, into one figure. They are useful for comparing homes quickly, and they are not the same thing as what your own house will do. Your bill, when it lands, is the gap between the single figure and the particular house, and that gap has a shape worth seeing.
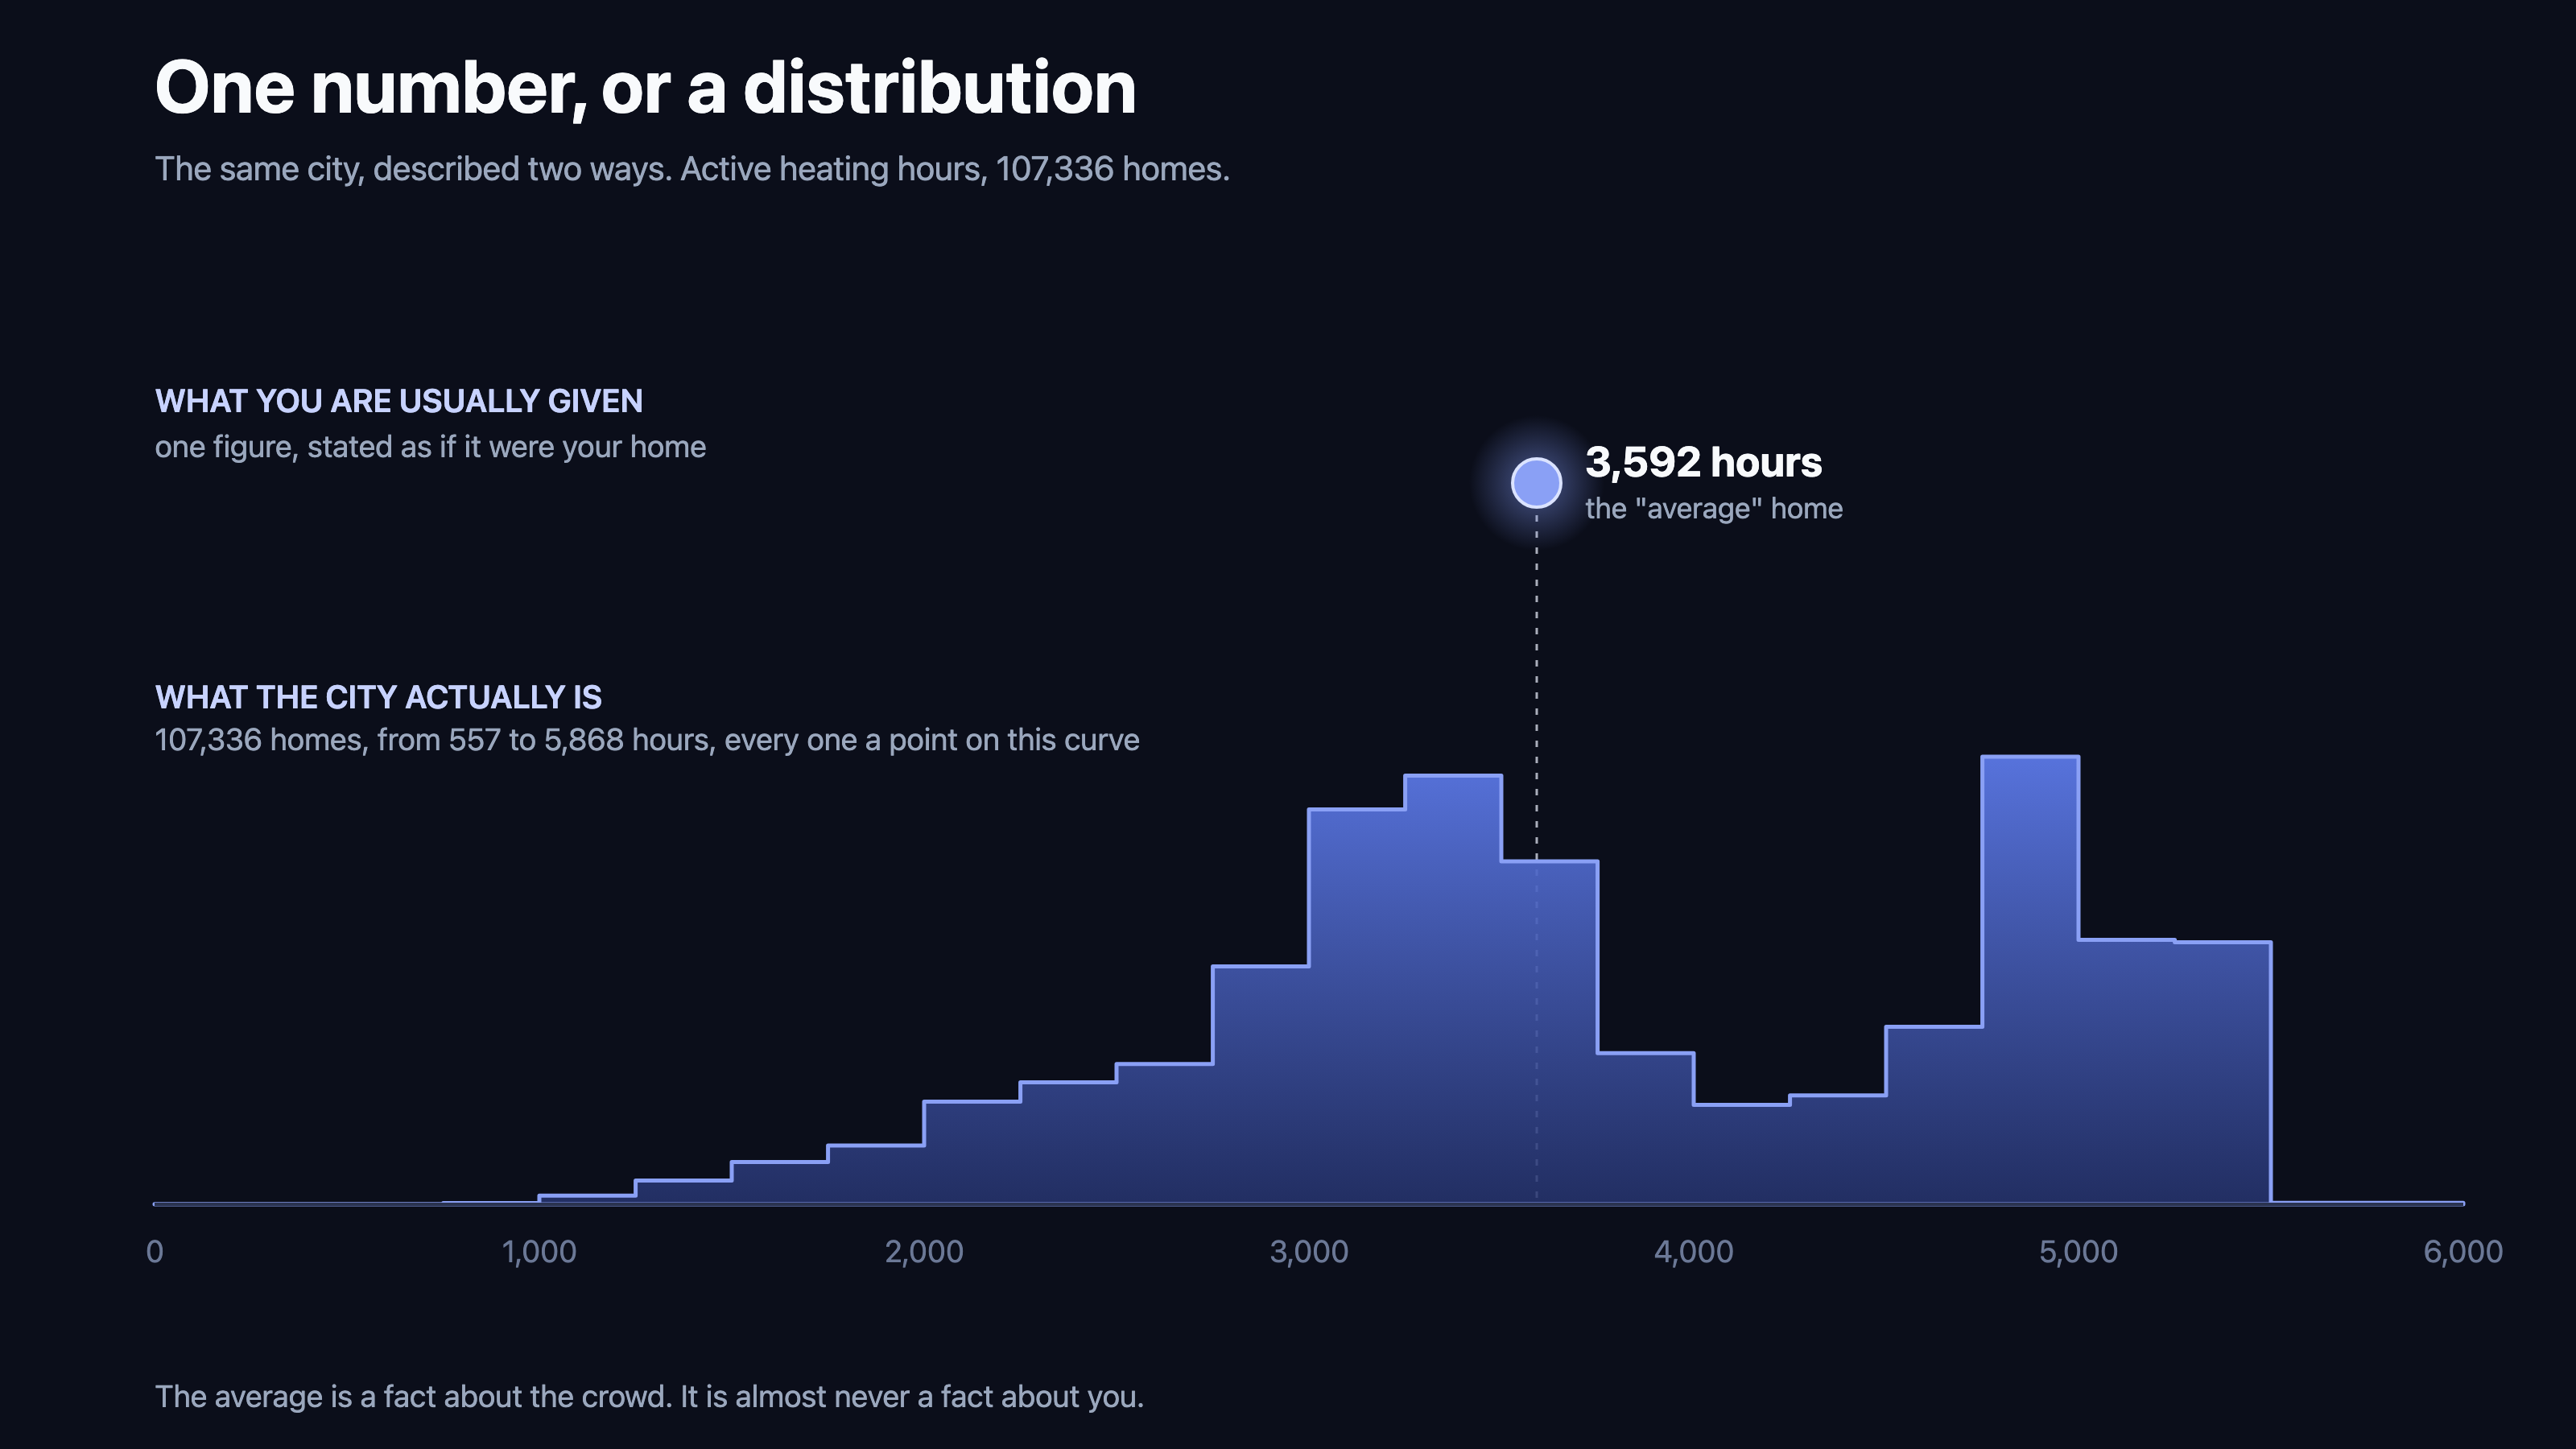
One number, or a distribution
Here is the idea made concrete. When we built our small pipework reading, we assumed a home's heating runs about 1,800 hours a year, the sort of single figure that sits inside a calculation and yields a tidy answer. Then we worked 107,336 homes through the government's national calculation method, hour by hour, and asked each one how long its heating was modelled to run. The median is not 1,800. It is close to 3,600. One home in ten is modelled to run past 5,175 hours, one in ten under 2,474, and across the whole set the curve stretches from a few hundred hours to nearly six thousand. The chart above is that spread, and the 1,800 mark sits far to the left of almost all of it.
The point is not only that the round number is low, though for the median home it is. It is that a single number cannot stand in for the curve. There is a wide distribution, and every home is one point on it. An average drawn across it lands in the middle, where fewer homes actually sit than you might think, and the further your home is from that middle the less the average has to say about your bill.
Why the same house is not the same house
Two homes that look the same on paper, same age, same size, same certificate band, can sit a long way apart on this curve. A band is a wide bucket, and inside it the details still differ: the loft that was topped up and the one that was not, a single draughty bay, a corner plot against a sheltered mid terrace. In this reading those recorded differences are what move a home along the curve. Real life adds more on top, because how a home is lived in and how warm it is kept vary from household to household in ways the method does not observe. Either way, none of it shows in a band, and all of it lands on the bill.
What to do with that
The averages do one job well: they sort a whole country quickly, and they are fine for that. They are simply the wrong tool for a decision about one home, because the thing they set aside is the thing you are deciding about: where your home sits on the curve. Before spending real money on a heat pump, a refit or insulation, the question worth answering is not what the average home saves. It is what yours does, and that can be a very different number.
Where this leaves you
For a single home, the useful first step is a reading of your own, found from what is already recorded about your house rather than an average laid over it. That is what the record HeatAssure keeps is for. For anyone looking after many homes, the same truth scales: the curve above can be drawn for any stock in England from public records, and the shape of your own stock's curve, where it bunches and where its outliers sit, is the start of every defensible spending decision.
About the numbers
- 107,336 homes across Nottingham, each worked through the national calculation method, full year, hourly, from public energy certificates. Active heating hours are the hours a home is modelled to be calling for space heat.
- Distribution of modelled active heating hours: minimum 557, 10th percentile 2,474, median 3,592, 90th percentile 5,175, maximum 5,868. The 1,800 hour round number sits below all but about one home in forty.
- The spread illustrates the principle; it is not a claim about any single home. Weather and occupancy schedules are the method's stated conventions, so the spread shown comes from recorded property characteristics; your own year and how you run your home would move your point further.
- Aggregates only. No figure for any single home leaves the analysis.