The Heat a City Cannot See
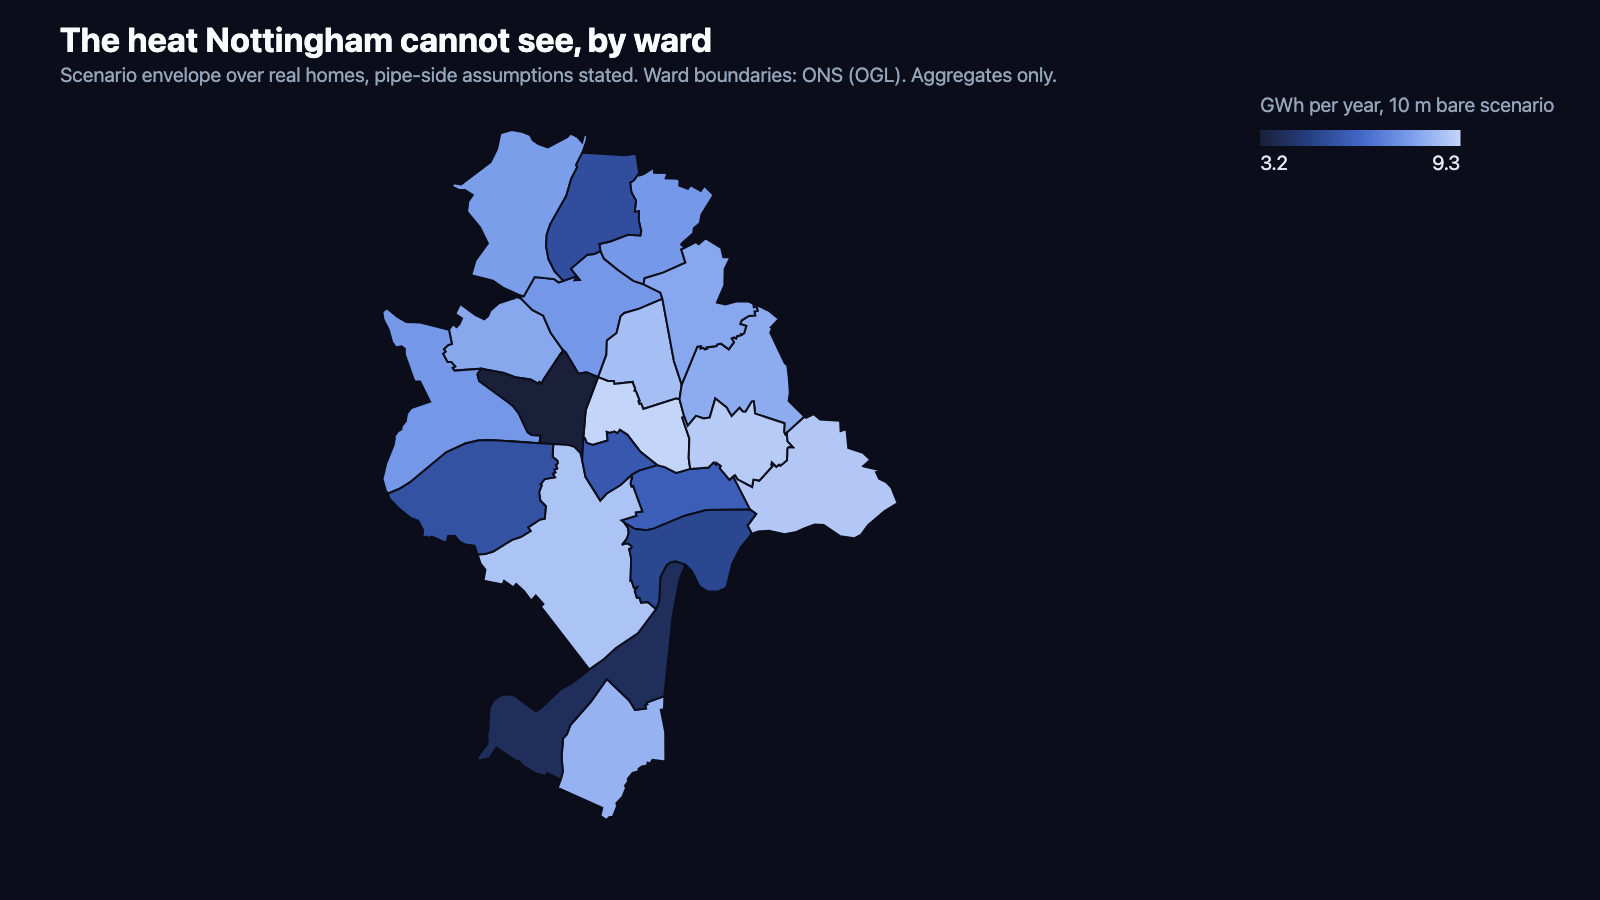
This map is live. Open the city view to choose the scenario and read every ward yourself.
Last week we published a small reading: what does the pipe between a heat pump and the house cost, one home at a time. The answer was modest, twenty-six pounds a year on the default settings, and one reader after another had the same reaction we did. That cannot be the whole story.
It is not. To see the rest of it, you need a whole city.
The envelope
We took the 107,336 homes of Nottingham the public record lets us price, every home compiled from that record and worked through the national calculation for a full year, hour by hour. Then we asked one question as a scenario envelope: if each of these homes had an external heat pump run of a stated length and insulation state, what would that pipe shed in a year, using each home's own modelled heating hours rather than anyone's assumption?
The pipe cases are explicit scenarios, stated in full in the method note, and they bracket the states a real pipe passes through in life. Specified means insulated to an enhanced 25 mm throughout. Minimum means the 13 mm a compliant install commonly gets. Bare is the state no guidance permits and weather eventually produces: lagging that has degraded, slipped or been stripped, which insulation specialists report within a few years of installation where the material was wrong for outdoor use. Nothing here claims to know any individual home's pipework. What the envelope shows is the size of the thing the official figures cannot show.
At ten metres per home, a long siting, the difference between specified and degraded-to-bare would be 119 GWh a year across the city: ten percent of everything these homes spend on space heating, roughly the space heating of ten thousand homes. Even inside a fully compliant world the stakes are real: minimum against specified is 44 GWh against 23 at ten metres, a city-scale difference produced entirely by a choice of lagging thickness. At five metres, the more typical siting, every figure roughly halves.
The map above is not uniform, and its unevenness is information. Hyson Green & Arboretum alone would shed 9.3 GWh a year in the degraded scenario; the quietest ward a third of that. Density does some of that work, but so do heating hours: the median home in Castle ward is modelled to heat for 2,732 hours a year, in Berridge for 4,834. A city is not one number, and neither is a street.
None of it appears in any compliance figure, for any home, anywhere. The national calculation models no pipework loss on emitter circuits at all; where pipework is in scope, the insulation is declared and never verified. On this envelope, a city can shed the heating of a town through a component no instrument of policy can see, and no record anywhere would show whether it is happening.
The correction we owed our own reading
The reading we published assumes a flat 1,800-hour heating season, a round number it had adopted without checking. The city run says otherwise. Across 107,336 homes, the median modelled heating year is 3,592 hours. One home in ten runs past 5,175.
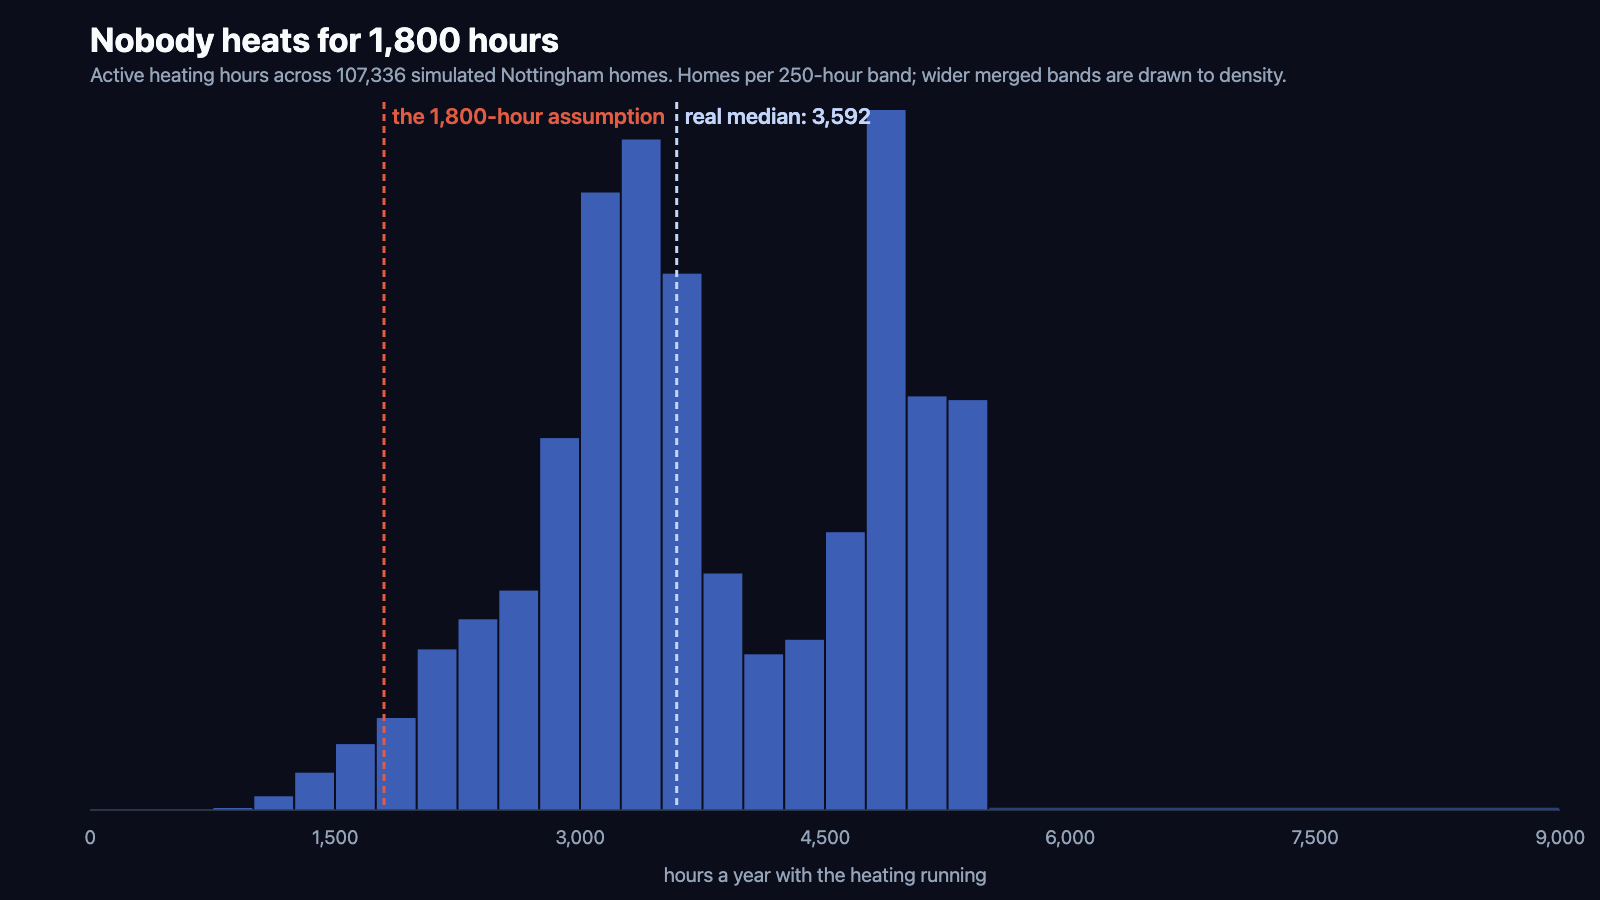
That assumption fits about one home in forty: 2.6 percent of the city heats for fewer than 1,800 hours. It understates the median home's pipework loss by half. Our own page carried the assumption, stated openly in its method note, and the city run now shows how conservative it was: the median ten metre degraded run is not 629 kWh a year but 1,255, and for the tail that heats longest, nearer 1,808. We have updated nothing quietly. The page said what it assumed; the city run said what the calculation finds; both statements stand, and the gap between them is exactly why a record kept per home beats a flat assumption.
Where this leaves you
If you look after housing stock, the question is not whether your homes lose heat this way. It is that nobody currently records whether they do: the insulation state was declared once and never verified since, and it does not stay as declared. The envelope above is a scenario, deliberately so, and the same reading can be drawn for any real stock in England from public data, before anyone visits, on the record HeatAssure keeps per home, outside the delivery chain it reports on. The view for one home prices one pipe; the crossing queue shows one estate; and this essay's city run is now a view of its own: the same reading at the scale of a city, live, ward by ward.
About the numbers
- Nottingham: 107,336 homes eligible for analysis, from 107,894 public energy certificates, each worked through the national calculation, full year, hourly. Active heating hours are each home's modelled hours with nonzero space heat demand: P10 2,474, P50 3,592, P90 5,175.
- The pipe cases are a scenario envelope over real homes, with the pipe assumptions stated: run lengths of 5 m and 10 m; bare 28 mm copper, 13 mm elastomeric (k=0.037), 25 mm phenolic (k=0.026); water at 45°C flow against 5°C ambient; the published pipe loss formula of the national calculation's technical reference. Bare is the degraded bound, priced because declared insulation is never verified and outdoor lagging degrades in service; it is never a claim that homes are installed that way.
- Cohort annual space heat 1,195 GWh. Scenario cells: 5 m bare 71.2 GWh; 5 m at 13 mm 22.0; 5 m at 25 mm 11.5; 10 m bare 142.4; 10 m at 13 mm 44.0; 10 m at 25 mm 23.0. The swing from bare to 25 mm is 5.0% of cohort space heat at 5 m, 10.0% at 10 m.
- The run lengths are stated scenarios, not a survey. No national statistic of external run lengths exists; installer guidance keeps runs as short as practicable, so 5 m is the more typical siting and 10 m the long one. Many dwellings, flats above all, cannot carry an external run of these lengths at all, which is one more reason these are envelope cells rather than a survey. The formula is linear in length: city wide, about 14.2 GWh a year per metre of degraded run.
- Ward boundaries are the ONS Open Geography wards (Open Government Licence); homes were joined to wards through the ONS Postcode Directory, May 2026 release, with all 107,336 homes matched. No ward reported holds fewer than ten homes.
- Every figure was recomputed twice by separate routes, and the formula implementation was checked against our published reading. The checks verify the arithmetic; the assumptions remain the stated scenario. Aggregates only; no figure for a single dwelling leaves the analysis.
- Illustrative scenario envelope, not a forecast, and not a claim about any individual home.