The Homes Moved On. The Records Didn't.
Every large landlord is planning the same decade: get the stock to EPC C by 2030, hold the Decent Homes line, and defend every pound of it to a board. Those plans rest on records, and across most of the stock the records are older than the works.
An EPC is valid for ten years, and nothing obliges a landlord to commission a new one when a home is improved. Through the 2010s and 2020s, grant programmes put insulation into social housing at scale, work that was funded, delivered and signed off, and then never found its way back into the certificate. A home whose loft was topped up in 2016 can still be wearing its 2014 assessment today. Multiply that by tens of thousands of homes and the baseline under an investment plan is a photograph of the stock as it used to be.
The cost runs in both directions
Plan on stale records and you pay twice. You price work the stock has already had, re-specifying insulation for homes that quietly meet the target. You also miss homes that are genuinely at risk, because the record overstating one home understates another. Planners who own this problem know it well: the first months of any programme go on cleansing and reconciling data before a single decision can be defended, and every reporting cycle after that, the statistical returns, the year-end carbon number, repeats the exercise by hand.
The same fact reads more kindly the other way round. Much of the sector is in stronger shape than its records show, because the work did happen and the evidence still exists, sitting in works histories, in grant documentation, in the register's own timeline. It was simply never gathered into one defensible statement of where each home stands now.
Finding where each home truly stands
That is what a current baseline really is: not a new invention, but the home's whole evidence trail gathered into one account, the register record, the works that followed it, and what follows from both. The result carries its own provenance. It shows which figures the register supports, which are inferred from the works history, and where there is nothing to go on at all. Being open about the gaps is what makes the baseline defensible, because when a number is challenged you can show where it came from.
A sound baseline is a means, though, and the plan is the end. Once every home carries a current, evidenced record, the questions that matter become computable rather than arguable.
What the plan looks like when it is computed
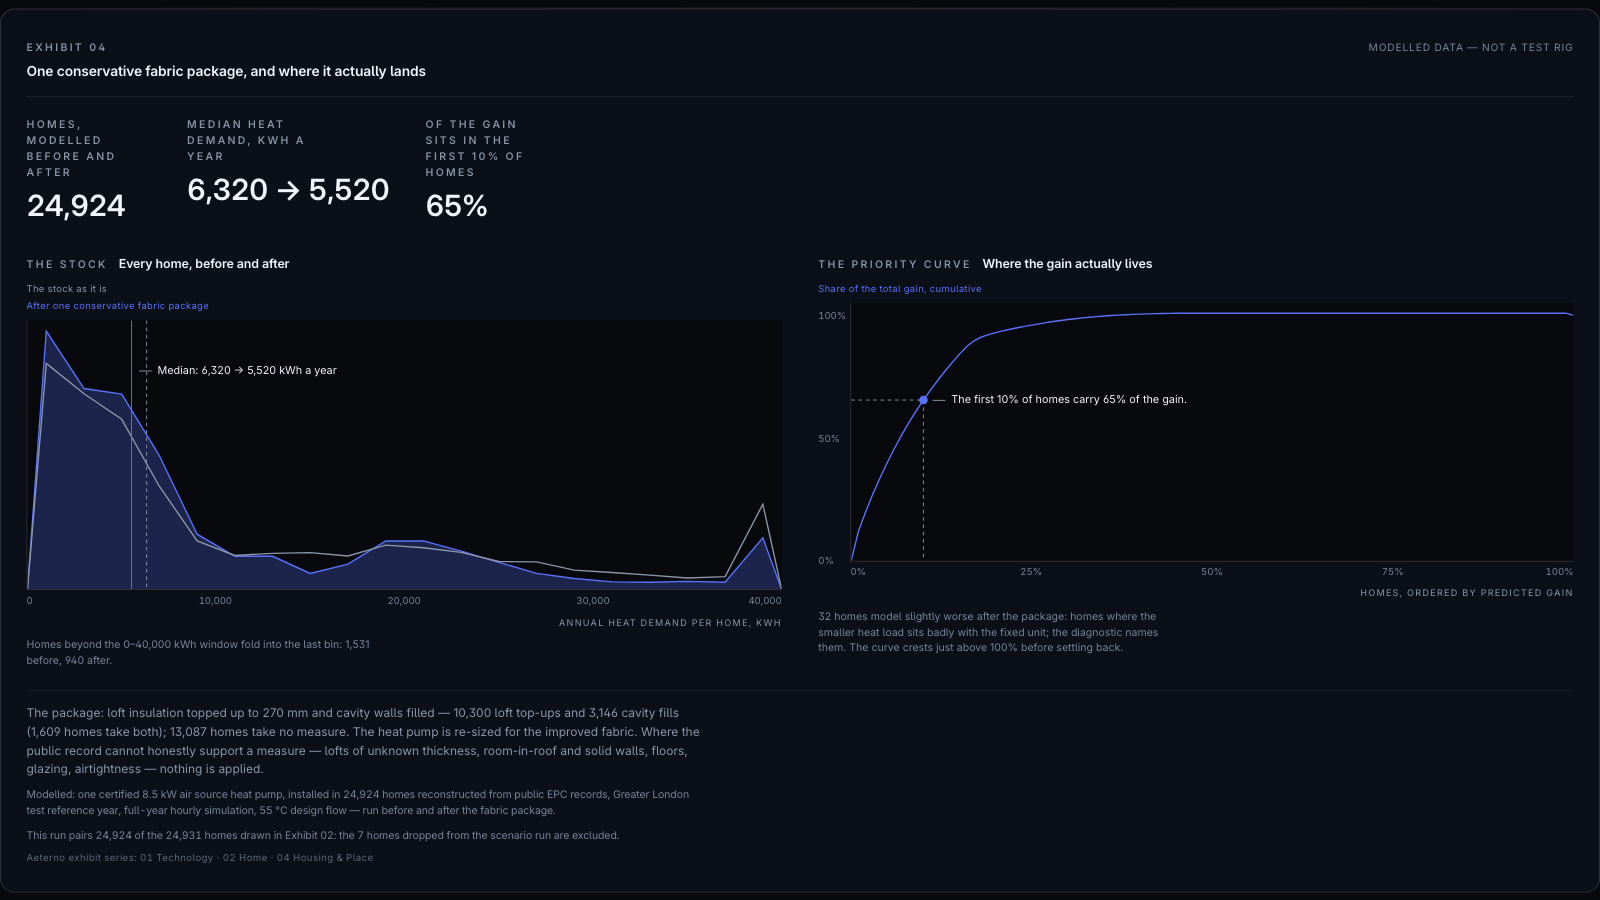
The exhibit above is one such computation, run on 24,924 homes reconstructed from public records: one conservative fabric package of loft top-ups and cavity fills, applied only where the evidence supports the measure, run through a full modelled year, before and after. Median heat demand falls from 6,320 to 5,520 kWh a year. The chart on the right is the part boards remember: ordered by predicted gain, the first 10% of homes carry 65% of the total. So the answer to "which homes first" is a curve, and the defensible ask is the knee of it.
That is the shape of planning on a found baseline. Which homes first, what gets each one to target, what it costs, and whether it performed as promised, with every answer traceable to the evidence behind it, as the exhibit's method notes show.
A plan is only as good as the baseline under it, and the baseline is the record: each home's account of what it is and what has been done to it, kept current as evidence arrives. That is the record HeatAssure keeps. Start where the records ended, and the decade gets cheaper.
Modelled data, reconstructed from public EPC records; figures and method as stated on the exhibit. See For Housing & Place for how the record composes into place-level investment views.