The Average Crosses Once
On Monday we left an estate half told. 305 homes in an English city, compiled from the public record and priced one at a time. At today's prices, 5 of them pay back a whole home retrofit inside fifteen years.
Which leaves the question every thirty year business case eventually has to answer. What would the price of energy have to do for the rest to follow?
We repriced the same estate to find out, and the answer surprised us twice.
What the average can tell you
Read as a single row, the estate pays back in about 108 years. Ask an average what has to change and it gives you one clean threshold: gas would have to rise roughly 400% before 108 years becomes fifteen. Allow for the cost range and that crossing sits anywhere between plus 320% and plus 470%.
That is still one threshold, which is all an average ever has. But it sits so far beyond any future anyone would price that the average's answer amounts to never. Read as one row, this estate does not say yes at any gas price you would put in a business case.
What the record says instead
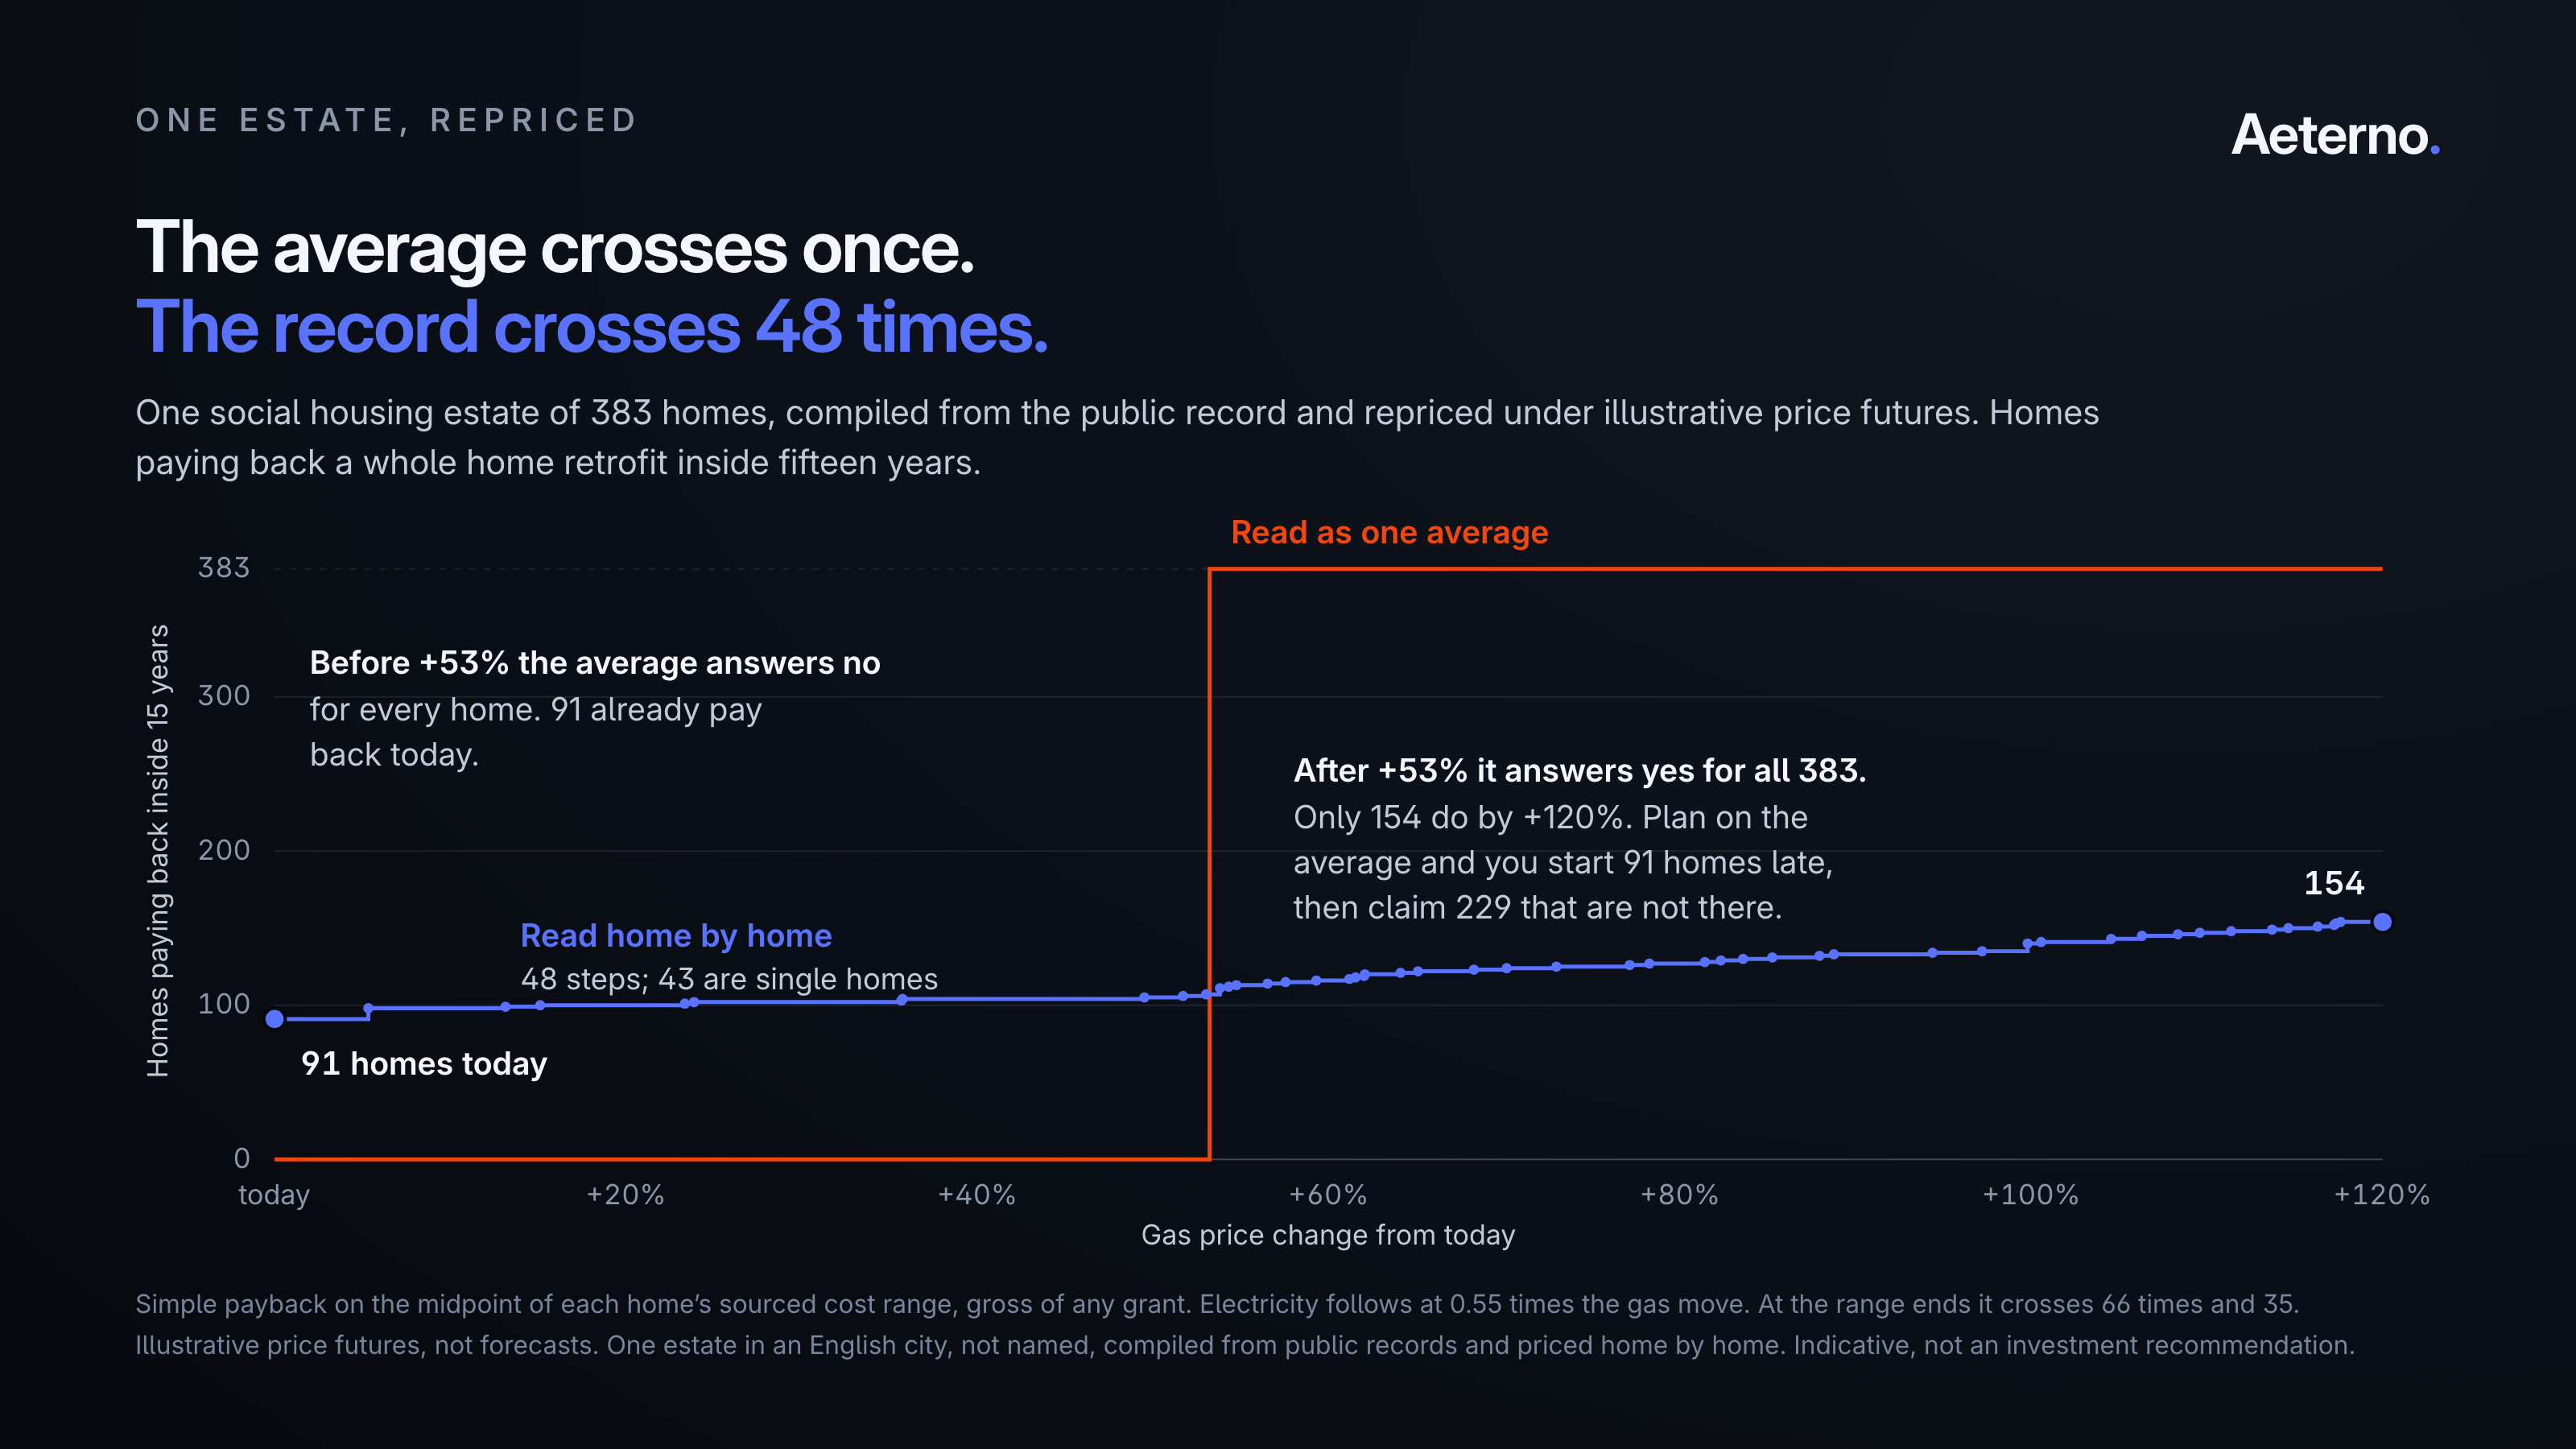
We repriced every home under illustrative price futures, taking gas from today's rate up to plus 120% and letting electricity follow at a bit over half the gas move. These are not forecasts. They are positions, held still, used to find out which parts of this estate are actually waiting on the market.
Five homes are not waiting at all. Three electric heated homes pay back in five to six years today, and one LPG home and one gas home sit just under the fifteen year line. That is the whole of the estate's settled first phase, and it is a decision about capital, not about gas.
The queue starts at plus 7.5%. The first crossing is a single home at gas up 7.5%, inside the noise of an ordinary year. From there the count climbs one home at a time: 27 homes by double gas, 32 by plus 120%. Every one of those 27 crossings is a single home, on its own, changing its mind. The typical gap between one crossing and the next is about three points of gas price.
And 273 of the 305 still say no at plus 120%. 102 of them are on a community heating scheme, where the question was never a heat pump in each home to begin with. For most of this estate the gas price is not the thing that decides it.
Why the average sits so far away
This is the second surprise, and it is the real finding. The average is not hiding an opportunity on this estate. It is hiding the fact that most of the opportunity was already taken.
The record shows an estate that has largely done the work. Of 305 homes, 167 are system built and 109 of those carry external wall insulation. Another 101 are cavity walled, and 82 of those cavities are filled. Just 20 homes are uninsulated solid brick. A third of the estate runs on a community heating scheme. 19 homes already have a heat pump in the ground.
An efficient home saves less from the same conversion, so the better the fabric, the thinner the bill case. That is why the average payback runs past a century: not because the estate is a bad candidate, but because it stopped being a candidate while the spreadsheet was not looking. A stock summary row carries none of this. The public record carries all of it.
Why steps, and not a curve
An average slides smoothly and crosses once, so it tells you there is a moment when the estate becomes worth doing. There is no such moment. There is a queue, and the price sets your position in it. On this estate the queue is 27 homes long across the whole priced range, and it is short for the best reason available: most of the queue already went through, years ago.
Where this leaves you
Nobody sent us anything. The estate was compiled from records that are already public, and the same can be done for any place in England.
Most business cases carry a threshold somewhere, the price at which the programme turns from a carbon case into a cash one. How many of your homes actually cross there, and how many crossed years ago without the summary row noticing?
The queue in this article is now a live view. Move the gas price yourself and watch the steps.
About the numbers
- The estate is not named, deliberately. The finding is about how one ordinary estate behaves when the price moves, and naming it would turn it into a story about one landlord.
- Every figure is indicative, compiled from the public energy certificate register and open location data. Nothing was measured, no home was visited, and no resident information is used or inferred. None of it is an investment recommendation.
- Price futures are illustrative positions, not forecasts. Electricity moves at 0.55 times the gas move, on the basis that a majority of marginal power in Great Britain is still set by gas. Each future is held constant rather than run as a path. The published data behind this article carries its own scenario ladder with electricity held flat, stopping at plus 100%; the figures here apply the stated escalation and extend to plus 120%, so any reconciliation should carry both assumptions with it.
- Simple payback throughout, on the midpoint of each home's sourced capital cost range, gross of any grant. No discounting, no carbon price, no maintenance difference, no residual value.
- The count of crossings is itself a function of that cost range, and the range moves it a long way. At the midpoint the estate crosses 27 times, at the low end of the cost range 50 times, and at the high end 23. The shape holds in all three. The exact count does not travel without its basis.
- 19 homes already have a heat pump from earlier works. The package as priced still installs one in every home, so those homes carry cost while returning almost no saving.
- All electricity is priced at one flat rate. Several of the electric heated homes will be on restricted hour tariffs, which would change both the starting bill and the saving. It is the assumption these figures are most exposed to.
- These figures replace those first published earlier on 30 July. We found and fixed a data processing fault the same day, and every figure above was recomputed in full before republication.